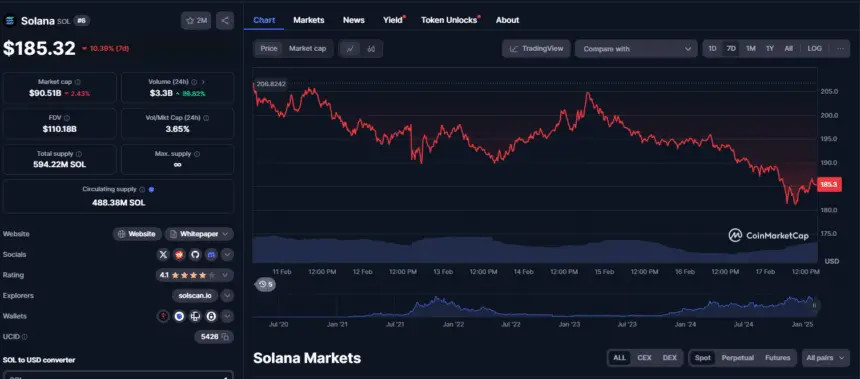
Solana has lost 10% of its value since last week, from when it was trading at a weekly high of $203 to now trading at $185.
Although the trading volume is relatively high as a 99.81% increase was recorded today alone to $3.3 billion, its market cap has dropped by 2.3%.

Recent Price Action
If we look at the daily chart via tradingView, we will see that the price is currently hovering near a support level at $174 that has been set up since November last year. Meanwhile, this support level was previously a resistance level of which price has been consolidating since March last year before the major breakout in November.
Right now, the chart is showing an ascending channel with forms of higher highs and lows. The price recently hit a new all-time high of $295. However, the price has pulled back after and is looking to retest the $174 support level again.

Road to $500: Is it possible?
On the Relative Strength Index (RSI) indicator, the line is currently below the 50 average level and nearing the oversold level, down to 27. This means the selling pressure might soon be over, and the bulls might soon take over the market. If this happens, we might experience a rally up 130% to $400 or even higher to $500.
Meanwhile, the SOL/BTC pair is showing a similar chart pattern from a previous cycle when SOL gained 65% in two weeks that pushing the price to $270. The rally was influenced by President Trump’s memecoin launch at the time.
If the current market conditions support this previous cycle, a price prediction for SOL of $400 to $500 might be expected. However, it’s too early to tell.
Also Read: Ethereum Stablecoin Supply Surges $1.1B in a Week